
Due to the Copy-On-Write nature of ZFS, we can get fragmented pools at some point. Some enhancements seems to be in the pipe but still, we cannot defragment a pool. The only way to workaround that is to do a full backup of the pool and restore everything. Hopefully, this should not happen too often (years) and the high amount of hits in ARC or L2ARC for metadata masks the delay ZFS could have trying to find the correct segments in the vdevs. Here is a presentation telling how to confirm a pool is fragmented.
Contents
Internals
- ZFS divides each vdevs into a few hundred regions called metaslabs.
-
A metaslab is divided into segments of not fixed size.
-
A spacemap tracks all the free space in a metaslab. It’s a log of allocations and frees, in time order.
-
2 areas of contiguous free space will be merged together in the spacemap
-
The metaslab allocator doesn’t necessarily use the largest free segment.
The figure below shows a visualization of the zpool after it is filled to 25% using a simple dd command (sequential writes). Each cell represents one metaslab. The pool here has 256 metaslabs (128MB each). The percentage value is the amount of free space in each metaslab. Here, around 32 metaslabs are full, accounting for 8GB of data :

After some time of random IO reads and writes onto the pool (reading 1 block and writing it again), the pool becomes fragmented :
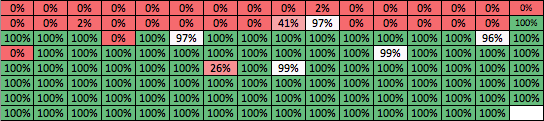
The pool is not compact, much more metaslabs are used. The majority of metaslabs have regions of free space. ZFS tries to place the random blocks in contiguous region of the pool by allocating new metaslabs. Due to copy-on-write, every time a block is overwritten it will create a hole somewhere in the pool. New data blocks can be allocated to new metaslabs or fill the holes if they fit in.
zdb
zdb is the ZFS debugger. It works well on a not busy pool. Under heavy load, it may just report “io error” or even crash.
   # zdb -emm MaPoule
   Metaslabs:
	vdev          0 <<< mirror-0
	metaslabs   116   offset                spacemap          free
	---------------   -------------------   ---------------   -------------
	metaslab      0   offset            0   spacemap     39   free    7.41G
	                  segments       7484   maxsize    487M   freepct   92%
	metaslab      1   offset    200000000   spacemap    150   free    5.97G
	                  segments       1280   maxsize   4.87G   freepct   74%
	metaslab      2   offset    400000000   spacemap     83   free     258M
	                  segments       1292   maxsize   21.2M   freepct    3%
	metaslab      3   offset    600000000   spacemap   2526   free     632M
	                  segments       1672   maxsize   39.9M   freepct    7%
        ...
	metaslab    115   offset   e600000000   spacemap      0   free       8G
	                  segments          1   maxsize      8G   freepct  100%
space_maps entries are to track the segments (space, offset)
Meaning
-
vdev 0 is made of 116 metaslabs
-
offset : metslab 0 starts at offset 0 and is made of 7484 segments
-
spacemap : space_maps entries are to track the segments (space, offset). metaslab 0 is tracked by spacemap #39, which is an object number in the DMU.
-
maxsize : metaslab 0 has a max contiguous free space of 487M
-
free : metaslab 0 has 7.41G of free space.
-
frepct : metaslab 0 92% of free space
Interpretation
- At the beginning, when no block is written to a vdev, the mumber of segments is equal to 1 and the spacemap number is 0 (no object allocated to the spacemap). It takes up no room in the pool until we start allocating from it.
- Having maxsize smaller than 128KB is an indication of potential fragmented filesystem. Note that the metaslab could just be full from serial writes
- Having too many segments in the metaslab is also an indication of fragmentation in this metaslab.
- Having bad balanced vdev (some full and other free) will impact performance
dtrace
metaslab_alloc_dva, easy
A way to determine if fragmentation is present is to measure how long metaslab_alloc_dva() takes.
   # dtrace -n 'metaslab_alloc_dva:entry { self->t = timestamp }
     metaslab_alloc_dva:return / self->t/ { printf("%u ms %Y",(timestamp - self->t)>>20,walltimestamp);}'

   CPU ID FUNCTION:NAME
   09 41948 metaslab_alloc_dva:return 0 ms 2014 Jan 31 13:04:19
   10 41948 metaslab_alloc_dva:return 0 ms 2014 Jan 31 13:04:19
   10 41948 metaslab_alloc_dva:return 0 ms 2014 Jan 31 13:04:19
   12 41948 metaslab_alloc_dva:return 0 ms 2014 Jan 31 13:04:19
   12 41948 metaslab_alloc_dva:return 0 ms 2014 Jan 31 13:04:20
   18 41948 metaslab_alloc_dva:return 0 ms 2014 Jan 31 13:04:19
   18 41948 metaslab_alloc_dva:return 0 ms 2014 Jan 31 13:04:19
   18 41948 metaslab_alloc_dva:return 0 ms 2014 Jan 31 13:04:19
   18 41948 metaslab_alloc_dva:return 0 ms 2014 Jan 31 13:04:19
   21 41948 metaslab_alloc_dva:return 0 ms 2014 Jan 31 13:04:19
metaslab_alloc_dva, improved
Display, every 10 seconds, the stacks involving metaslab_alloc_dva() when it takes more than 1ms to complete
   #!/usr/sbin/dtrace -Cqs

   #define MAX(a, b) (a>b ? a : b)
   #define STACK_PRINT_US 1000000 /* 1000000us = 1ms */

   dtrace:::BEGIN
   {
      dva_max = 0;
   }

   metaslab_alloc_dva:entry
   {
      self->t = timestamp
   }

   metaslab_alloc_dva:return / self->t /
   {
      self->diff = timestamp - self->t;
      dva_max = MAX(dva_max, self->diff);
   }

   metaslab_alloc_dva:return / self->t && self->diff > STACK_PRINT_US /
   {
      /* we grab the stacks only if the current thread has taken more than STACK_PRINT_US us */
      @s[stack()] = count();
   }

   tick-10s
   {
      printf("\n");
      printf("----- %Y -----\n",walltimestamp);
      printf(" dva_max = %d\n",dva_max);
      printf("Stacks when metaslab_alloc_dva > %dus : \n",STACK_PRINT_US);
      printa(@s);
      trunc(@s);
      dva_max = 0;
    }
Results :
   host# ./dva_max.d
   ----- 2014 Jan 31 14:23:16 -----
   dva_max = 3827391
   Stacks when metaslab_alloc_dva > 1000000us :

   zfs`metaslab_alloc+0xd6
   zfs`zio_dva_allocate+0xd8
   zfs`zio_execute+0x8d
   genunix`taskq_thread+0x22e
   unix`thread_start+0x8
   545
seeksize.d
Trying to determine the overall seek distance of the disk heads can help to determine if the pool is fragmented. There are other factors of large disk heads movements (dedup), but this is worth considering. The seeksize.d script is part of the DTrace Toolkit and is deeply explained in the dtrace Book from Brendan Greg. See http://dtrace.org/blogs/brendan/2010/09/23/dtrace-book-coming-soon/ (Chap4 page 184).
   #!/usr/sbin/dtrace -s
   /*
   * seeksize.d - analyse disk head seek distance by process.
   * Written using DTrace (Solaris 10 3/05).
   */
   #pragma D option quiet</code>

   dtrace:::BEGIN
   {
      printf("Tracing... Hit Ctrl-C to end.\n");
   }

   self int last[dev_t];

   io:genunix::start
   {
      /* save last position of disk head */
      self->last[args[0]->b_edev] = args[0]->b_blkno + args[0]->b_bcount / 512;
   }

   io:genunix::start
   /self->last[args[0]->b_edev] != 0/
   {
      /* calculate seek distance */
      this->last = self->last[args[0]->b_edev];
      this->dist = (int)(args[0]->b_blkno - this->last) > 0 ?
                   args[0]->b_blkno - this->last : this->last - args[0]->b_blkno;

      /* store details */
      @Size[pid, curpsinfo->pr_psargs] = quantize(this->;dist);
   }

   dtrace:::END
   {
      printf("\n%8s %s\n", "PID", "CMD");
      printa("%8d %S\n%@d\n", @Size);
   }
Output example :
   # ./seeksize.d
   ^C
     PID  CMD
     613  zpool-pool-raid

           value  ------------- Distribution ------------- count
              -1 |                                         0
               0 |@                                        16
               1 |                                         11
               2 |@                                        32
               4 |@                                        40
               8 |@                                        18
              16 |                                         6
              32 |                                         12
              64 |@                                        26
             128 |                                         2
             256 |@@                                       61
             512 |                                         0
            1024 |@@@@@@                                   191
            2048 |@@@@                                     111
            4096 |@                                        24
            8192 |@@@@@@@                                  234
           16384 |                                         0
           32768 |                                         0
           65536 |                                         0
          131072 |                                         11
          262144 |                                         12
          524288 |                                         13
         1048576 |                                         0
         2097152 |                                         0
         4194304 |@@@@@@                                   193
         8388608 |                                         0
        16777216 |                                         0
        33554432 |                                         0
        67108864 |                                         0
       134217728 |                                         0
       268435456 |                                         0
       536870912 |@                                        47
      1073741824 |@@@@@                                    162
      2147483648 |                                         0
      4294967296 |@                                        45
      8589934592 |                                         0
The way ZFS is designed (maximize the amount of data in DRAM) can hide the head movements. When doing IO writes, ZFS tries to group IOS in contiguous segments of each metaslab and may fill empty ones.